Mechanical Components » Motors and Gearboxes » Plastic DC Gearmotors »
700:1 Sub-Micro Plastic Planetary Gearmotor 6Dx21L mm
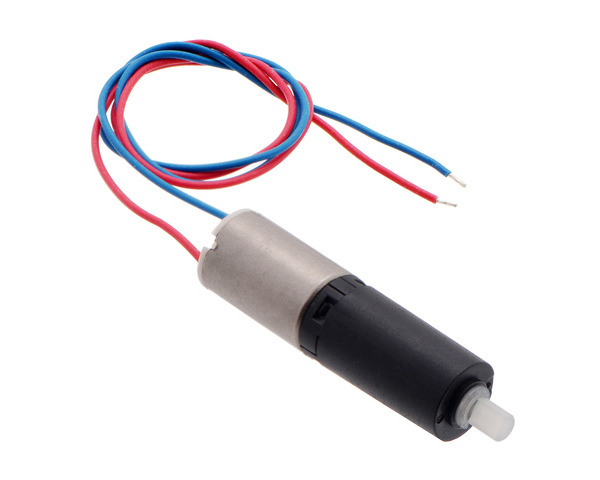
This tiny, cylindrical gearmotor consists of a coreless brushed DC motor and a 700:1 plastic planetary gearbox. The entire assembly has a diameter of just 6 mm (0.24″) and an extremely light weight of 1.3 g (0.046 oz), making it a great actuator for miniature robots and very small mechanisms.
Key specs at 6 V: 90 RPM and 45 mA free-run, 12 oz-in (0.9 kg-cm) and 400 mA stall.
Alternatives available with variations in these parameter(s): gear ratio Select variant…
| Description | Specs (8) | Pictures (6) | Resources (3) | FAQs (1) | On the blog (0) | Distributors (43) |
|---|
- I need additional information about this motor; do you have a datasheet?
No; the information we have available for this motor can be found on its product page. However, you can approximate various additional motor parameters from the information found in the “Specs” tab.
The electrical resistance of the motor can be approximated by dividing the rated voltage by the stall current (at the rated voltage). The electromotive force constant (Ke) can be approximated by dividing the rated voltage by the free-run speed (at the rated voltage). To approximate the motor torque constant (Kt), you can divide the stall torque by the stall current.
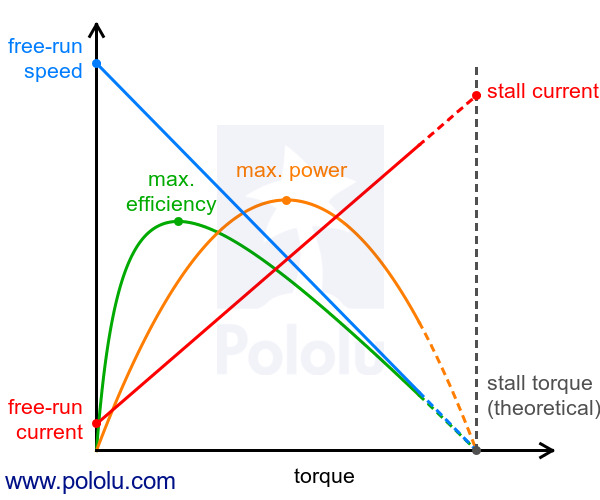
For pretty much any DC motor, the current, speed, power, and efficiency curves as a function of torque will look like those in the graph below (assuming motor voltage and temperature are constant):

The current and speed curves are approximately linear, and the product pages for our motors provide the approximate end points for these lines: (0 torque, no-load current) and (stall torque, stall current) for the red line, and (0 torque, no-load speed) and (stall torque, 0 speed) for the blue line.
The orange output power curve is the product of the speed and the torque, which results in an inverted parabola with its peak at 50% of the stall torque.
The green efficiency curve is the output power divided by the input power, where the input power is current times voltage. The voltage is constant, so you can divide the output power curve by the current line to get the general shape of the efficiency curve, which in turn lets you identify the torque, speed, and current that correspond to max efficiency.
There are many programs out there that you can use to generate these curves. For example, if you have access to MATLAB, you can use this customer-created MATLAB script to generate these motor plots for you from the specifications we provide for each gearmotor.
Note: A good general rule of thumb is to keep the continuous load on a DC motor from exceeding approximately 20% to 30% of the stall torque. Stalling gearmotors can greatly decrease their lifetimes, occasionally resulting in immediate damage to the gearbox or thermal damage to the motor windings or brushes. Do not expect to be able to safely operate a brushed DC gearmotor all the way to stall. The safe operating range will depend on the specifics of the gearmotor itself.


