Support » Pololu Jrk USB Motor Controller User’s Guide » 3. Configuring the Motor Controller »
3.g. The Plots Window
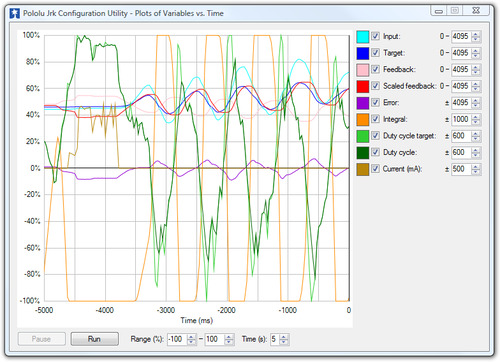
The Plots window of the configuration utility displays real-time data from the jrk, scrolling from right to left. To access this window, select “Plots” from the Window menu, or click on the small plot displayed in the upper-right corner of the main window. All of the variables discussed in Section 1.c are available.
Each variable can be independently scaled to a useful range. For example, the Error can be from -4095 to +4095, but for well-tuned feedback systems, it will usually have a much smaller value, so setting the range to ±100 might provide a more useful plot.
The plot shows all variables on a scale from -100% to 100%, where 100% represents the high end of the variable’s range. The percentage range displayed on the plot can also be adjusted, using the Range settings at the bottom of the plot window.
By default, the plot shows data from the past 5 seconds, with the most recent values on the right and the older values on the left. The time scale of the plot can be shortened using the Time (s) setting at the bottom of the window.
The color of each variable in the graph can be selected by double clicking on the colored box next to the variable’s name.
Each variable can be independently shown or hidden using the checkbox next to the variable’s name.
Here is an example showing all variables plotted simultaneously:
 |


